Adaptive Price Channel StrategyThis strategy is an adaptive price channel strategy based on the Average True Range (ATR) indicator and the Average Directional Index (ADX). It aims to identify sideways markets and trends in the price movements and make trades accordingly.
The strategy uses a length parameter for the ATR and ADX indicators, which determines the length of the calculation for these indicators. The strategy also uses an ATR multiplier, which is multiplied by the ATR to determine the upper and lower bounds of the price channel.
The first step of the strategy is to calculate the highest high (HH) and lowest low (LL) over the specified length. The ATR is also calculated over the same length. Then the strategy calculates the positive directional indicator (+DI) and negative directional indicator (-DI) based on the up and down moves in the price, and uses these to calculate the ADX.
If the ADX is less than 25, the market is considered to be in a sideways phase. In this case, if the price closes above the upper bound of the price channel (HH - ATR multiplier * ATR), the strategy enters a long position, and if the price closes below the lower bound of the price channel (LL + ATR multiplier * ATR), the strategy enters a short position.
If the ADX is greater than or equal to 25 and the +DI is greater than the -DI, the market is considered to be in a bullish phase. In this case, if the price closes above the upper bound of the price channel, the strategy enters a long position. If the ADX is greater than or equal to 25 and the +DI is less than the -DI, the market is considered to be in a bearish phase. In this case, if the price closes below the lower bound of the price channel, the strategy enters a short position.
The strategy exits a position after a certain number of bars have passed since the entry, as specified by the exit_length input.
In summary, this strategy attempts to trade in accordance with the prevailing market conditions by identifying sideways markets and trends and making trades based on price movements within a dynamically-adjusted price channel.
This strategy takes a read on the market and either takes a channel strategy or trades volatility based on current trend. Works well on 2, 3 ,4, 12 hour for BTC. It’s my first attempt and creating a strategy. I am very interested in constructive criticism. I will look into better risk management, maybe a trailing stop loss. Other suggestions welcome. This is my first attempt at a strategy.
Here are the settings I used.
Inputs
Length 20
Exit 10
ATR 3.2
Dates I picked when I got into Crypto
Properties
Capital 1000
Order size 2 Contracts
Pyramiding 1
Commission .05
Cari dalam skrip untuk "Trailing stop"

Candle Counter [theEccentricTrader]█ OVERVIEW
This indicator counts the number of confirmed candle scenarios on any given candlestick chart and displays the statistics in a table, which can be repositioned and resized at the user's discretion.
█ CONCEPTS
Green and Red Candles
A green candle is one that closes with a high price equal to or above the price it opened.
A red candle is one that closes with a low price that is lower than the price it opened.
Upper Candle Trends
A higher high candle is one that closes with a higher high price than the high price of the preceding candle.
A lower high candle is one that closes with a lower high price than the high price of the preceding candle.
A double-top candle is one that closes with a high price that is equal to the high price of the preceding candle.
Lower Candle Trends
A higher low candle is one that closes with a higher low price than the low price of the preceding candle.
A lower low candle is one that closes with a lower low price than the low price of the preceding candle.
A double-bottom candle is one that closes with a low price that is equal to the low price of the preceding candle.
█ FEATURES
Inputs
Start Date
End Date
Position
Text Size
Show Sample Period
Show Plots
Table
The table is colour coded, consists of three columns and twenty-two rows. Blue cells denote all candle scenarios, green cells denote green candle scenarios and red cells denote red candle scenarios.
The candle scenarios are listed in the first column with their corresponding total counts to the right, in the second column. The last row in column one, row twenty-two, displays the sample period which can be adjusted or hidden via indicator settings.
Rows two and three in the third column of the table display the total green and red candles as percentages of total candles. Rows four to nine in column three, coloured blue, display the corresponding candle scenarios as percentages of total candles. Rows ten to fifteen in column three, coloured green, display the corresponding candle scenarios as percentages of total green candles. And lastly, rows sixteen to twenty-one in column three, coloured red, display the corresponding candle scenarios as percentages of total red candles.
Plots
I have added plots as a visual aid to the various candle scenarios listed in the table. Green up-arrows denote higher high candles when above bar and higher low candles when below bar. Red down-arrows denote lower high candles when above bar and lower low candles when below bar. Similarly, blue diamonds when above bar denote double-top candles and when below bar denote double-bottom candles. These plots can also be hidden via indicator settings.
█ HOW TO USE
This indicator is intended for research purposes and strategy development. I hope it will be useful in helping to gain a better understanding of the underlying dynamics at play on any given market and timeframe. It can, for example, give you an idea of any inherent biases such as a greater proportion of green candles to red. Or a greater proportion of higher low green candles to lower low green candles. Such information can be very useful when conducting top down analysis across multiple timeframes, or considering trailing stop loss methods.
What you do with these statistics and how far you decide to take your research is entirely up to you, the possibilities are endless.
This is just the first and most basic in a series of indicators that can be used to study objective price action scenarios and develop a systematic approach to trading.
█ LIMITATIONS
Some higher timeframe candles on tickers with larger lookbacks such as the DXY, do not actually contain all the open, high, low and close (OHLC) data at the beginning of the chart. Instead, they use the close price for open, high and low prices. So, while we can determine whether the close price is higher or lower than the preceding close price, there is no way of knowing what actually happened intra-bar for these candles. And by default candles that close at the same price as the open price, will be counted as green. You can avoid this problem by utilising the sample period filter.
The green and red candle calculations are based solely on differences between open and close prices, as such I have made no attempt to account for green candles that gap lower and close below the close price of the preceding candle, or red candles that gap higher and close above the close price of the preceding candle. I can only recommend using 24-hour markets, if and where possible, as there are far fewer gaps and, generally, more data to work with. Alternatively, you can replace the scenarios with your own logic to account for the gap anomalies, if you are feeling up to the challenge.
It is also worth noting that the sample size will be limited to your Trading View subscription plan. Premium users get 20,000 candles worth of data, pro+ and pro users get 10,000, and basic users get 5,000. If upgrading is currently not an option, you can always keep a rolling tally of the statistics in an excel spreadsheet or something of the like.

Advanced VWAP_Pullback Strategy_Trend-Template QualifierGeneral Description and Unique Features of this Script
Introducing the Advanced VWAP Momentum-Pullback Strategy (long-only) that offers several unique features:
1. Our script/strategy utilizes Mark Minervini's Trend-Template as a qualifier for identifying stocks and other financial securities in confirmed uptrends. Mark Minervini, a 2x US Investment Champion, developed the Trend-Template, which covers eight different and independent characteristics that can be adjusted and optimized in this trend-following strategy to ensure the best results. The strategy will only trigger buy-signals in case the optimized qualifiers are being met.
2. Our strategy is based on the supply/demand balance in the market, making it timeless and effective across all timeframes. Whether you are day trading using 1- or 5-min charts or swing-trading using daily charts, this strategy can be applied and works very well.
3. We have also integrated technical indicators such as the RSI and the MA / VWAP crossover into this strategy to identify low-risk pullback entries in the context of confirmed uptrends. By doing so, the risk profile of this strategy and drawdowns are being reduced to an absolute minimum.
Minervini’s Trend-Template and the ‘Stage-Analysis’ of the Markets
This strategy is a so-called 'long-only' strategy. This means that we only take long positions, short positions are not considered.
The best market environment for such strategies are periods of stable upward trends in the so-called stage 2 - uptrend.
In stable upward trends, we increase our market exposure and risk.
In sideways markets and downward trends or bear markets, we reduce our exposure very quickly or go 100% to cash and wait for the markets to recover and improve. This allows us to avoid major losses and drawdowns.
This simple rule gives us a significant advantage over most undisciplined traders and amateurs!
'The Trend is your Friend'. This is a very old but true quote.
What's behind it???
• 98% of stocks made their biggest gains in a Phase 2 upward trend.
• If a stock is in a stable uptrend, this is evidence that larger institutions are buying the stock sustainably.
• By focusing on stocks that are in a stable uptrend, the chances of profit are significantly increased.
• In a stable uptrend, investors know exactly what to expect from further price developments. This makes it possible to locate low-risk entry points.
The goal is not to buy at the lowest price – the goal is to buy at the right price!
Each stock goes through the same maturity cycle – it starts at stage 1 and ends at stage 4
Stage 1 – Neglect Phase – Consolidation
Stage 2 – Progressive Phase – Accumulation
Stage 3 – Topping Phase – Distribution
Stage 4 – Downtrend – Capitulation
This strategy focuses on identifying stocks in confirmed stage 2 uptrends. This in itself gives us an advantage over long-term investors and less professional traders.
By focusing on stocks in a stage 2 uptrend, we avoid losses in downtrends (stage 4) or less profitable consolidation phases (stages 1 and 3). We are fully invested and put our money to work for us, and we are fully invested when stocks are in their stage 2 uptrends.
But how can we use technical chart analysis to find stocks that are in a stable stage 2 uptrend?
Mark Minervini has developed the so-called 'trend template' for this purpose. This is an essential part of our JS-TechTrading pullback strategy. For our watchlists, only those individual values that meet the tough requirements of Minervini's trend template are eligible.
The Trend Template
• 200d MA increasing over a period of at least 1 month, better 4-5 months or longer
• 150d MA above 200d MA
• 50d MA above 150d MA and 200d MA
• Course above 50d MA, 150d MA and 200d MA
• Ideally, the 50d MA is increasing over at least 1 month
• Price at least 25% above the 52w low
• Price within 25% of 52w high
• High relative strength according to IBD.
NOTE: In this basic version of the script, the Trend-Template has to be used as a separate indicator on TradingView (Public Trend-Template indicators are available in TradingView – community scripts). It is recommended to only execute buy signals in case the stock or financial security is in a stage 2 uptrend, which means that the criteria of the trend-template are fulfilled.
This strategy can be applied to all timeframes from 5 min to daily.
The VWAP Momentum-Pullback Strategy
For the JS-TechTrading VWAP Momentum-Pullback Strategy, only stocks and other financial instruments that meet the selected criteria of Mark Minervini's trend template are recommended for algorithmic trading with this startegy.
A further prerequisite for generating a buy signals is that the individual value is in a short-term oversold state (RSI).
When the selling pressure is over and the continuation of the uptrend can be confirmed by the MA / VWAP crossover after reaching a price low, a buy signal is issued by this strategy.
Stop-loss limits and profit targets can be set variably. You also have the option to make use of the trailing stop exit strategy.
Relative Strength Index (RSI)
The Relative Strength Index (RSI) is a technical indicator developed by Welles Wilder in 1978. The RSI is used to perform a market value analysis and identify the strength of a trend as well as overbought and oversold conditions. The indicator is calculated on a scale from 0 to 100 and shows how much an asset has risen or fallen relative to its own price in recent periods.
The RSI is calculated as the ratio of average profits to average losses over a certain period of time. A high value of the RSI indicates an overbought situation, while a low value indicates an oversold situation. Typically, a value > 70 is considered an overbought threshold and a value < 30 is considered an oversold threshold. A value above 70 signals that a single value may be overvalued and a decrease in price is likely , while a value below 30 signals that a single value may be undervalued and an increase in price is likely.
For example, let's say you're watching a stock XYZ. After a prolonged falling movement, the RSI value of this stock has fallen to 26. This means that the stock is oversold and that it is time for a potential recovery. Therefore, a trader might decide to buy this stock in the hope that it will rise again soon.
The MA / VWAP Crossover Trading Strategy
This strategy combines two popular technical indicators: the Moving Average (MA) and the Volume Weighted Average Price (VWAP). The MA VWAP crossover strategy is used to identify potential trend reversals and entry/exit points in the market.
The VWAP is calculated by taking the average price of an asset for a given period, weighted by the volume traded at each price level. The MA, on the other hand, is calculated by taking the average price of an asset over a specified number of periods. When the MA crosses above the VWAP, it suggests that buying pressure is increasing, and it may be a good time to enter a long position. When the MA crosses below the VWAP, it suggests that selling pressure is increasing, and it may be a good time to exit a long position or enter a short position.
Traders typically use the MA VWAP crossover strategy in conjunction with other technical indicators and fundamental analysis to make more informed trading decisions. As with any trading strategy, it is important to carefully consider the risks and potential rewards before making any trades.
This strategy is applicable to all timeframes and the relevant parameters for the underlying indicators (RSI and MA/VWAP) can be adjusted and optimized as needed.
Backtesting
Backtesting gives outstanding results on all timeframes and drawdowns can be reduced to a minimum level. In this example, the hourly chart for MCFT has been used.
Settings for backtesting are:
- Period from Jan 2020 until March 2023
- Starting capital 100k USD
- Position size = 25% of equity
- 0.01% commission = USD 2.50.- per Trade
- Slippage = 2 ticks
Other comments
- This strategy has been designed to identify the most promising, highest probability entries and trades for each stock or other financial security.
- The combination of the Trend-Template and the RSI qualifiers results in a highly selective strategy which only considers the most promising swing-trading entries. As a result, you will normally only find a low number of trades for each stock or other financial security per year in case you apply this strategy for the daily charts. Shorter timeframes will result in a higher number of trades / year.
- Consequently, traders need to apply this strategy for a full watchlist rather than just one financial security.

Drip's 11am rule breakout/breakdown (OG)This indicator is based on Drippy2hard's 11:30 am (EST) rule.
In simple terms the rule states that:
If a trending stock makes a new high after 11:15-11:30am EST, there is a 75% chance of closing within 1% of High of day (HOD). Same applies for downtrend.
Please note:
Not all stocks will abide by this, this is backtested on stocks with avg daily volume > 2M and mostly mega cap stocks which have liquid option chains. The backtesting results show very promising results on $SPY/ $SPX so it is advised to trade $SPY/ $SPX using this indicator over any other stocks.
Although the name suggests 11 AM rule, the backtesting shows higher win rate for 11:30 AM so please select that option in the settings.
As always, no indicator is perfect and please follow your risk management and understand that indicators are tools to aid your trading and by no means they are supposed to work as intended in all scenarios
How the script works
1. A HOD/LOD zone is identified based on regular session (9:30am-11:30am) EST. Users can select cut off time to 11AM in the settings. These will be indicated on chart after 11/11:30pm depending on what user selected
2. If the stock breaks above the HOD and the ADX is showing strong momentum to upside then the candlesticks will start showing neon color, if the trend based on moving averages and candle closing is also bullish then the indicator will show trend arrows under the candle indicating to stay in the trade. Same applies for break below LOD, only the colors will change to represent downtrend.
3. An optional cloud is also shown if the trend is developed. The cloud can be used as trail stop or re entry point as long as it is displayed on chart
How to use the indicator in trading
In general, there are three scenarios which are trade worthy
1. If the stocks breaks out above the HOD zone and up trend develops or the stocks breaks below the LOD zone and downtrend develops. See images below
2. You can also use the LOD/HOD zone as demand/ supply if the Price action is range bound like this example below
Thanks for reading, please give thumbs up if you like using it! Please post comments on how to use it.

Exponential Stochastic Strategywhat is Exponential Stochastic?
it is a modified version of the stochastic indicator. This strategy does not include pyramiding, repaint, trailing stop or take profit.
what it does?
It contains an extra input in addition to the stochastic indicator. Thanks to this input, different exponential weights can be given to the outputs and the indicator can be made more sensitive or insensitive. The strategy buys when the indicator leaves the overbought zone, sells when it leaves the oversold zone and always stays in the trade.
how it does it?
it uses this formula: i.hizliresim.com
Thanks to this formula, even if the weights given to the outputs change, the indicator always continues to take a value between 0 and 100.
how to use it ?
With the input named "exp", you can change the sensitivity of the indicator and develop different strategies. other inputs are the same as the stochastic indicator. Increasing the exp value causes the indicator to signal less, decreasing it makes it much more sensitive.

Strategy Myth-Busting #11 - TrendMagic+SqzMom+CDV - [MYN]This is part of a new series we are calling "Strategy Myth-Busting" where we take open public manual trading strategies and automate them. The goal is to not only validate the authenticity of the claims but to provide an automated version for traders who wish to trade autonomously.
Our 11th one is an automated version of the "Magic Trading Strategy : Most Profitable Indicator : 1 Minute Scalping Strategy Crypto" strategy from "Fx MENTOR US" who doesn't make any official claims but given the indicators he was using, it looked like on the surface that this might actually work. The strategy author uses this on the 1 minute and 3 minute timeframes on mostly FOREX and Heiken Ashi candles but as the title of his strategy indicates is designed for Crypto. So who knows..
To backtest this accurately and get a better picture we resolved the Heiken Ashi bars to standard candlesticks . Even so, I was unable to sustain any consistency in my results on either the 1 or 3 min time frames and both FOREX and Crypto. 10000% Busted.
This strategy uses a combination of 3 open-source public indicators:
Trend Magic by KivancOzbilgic
Squeeze Momentum by LazyBear
Cumulative Delta Volume by LonesomeTheBlue
Trend Magic consists of two main indicators to validate momentum and volatility. It uses an ATR like a trailing Stop to determine the overarching momentum and CCI as a means to validate volatility. Together these are used as the primary indicator in this strategy. When the CCI is above 0 this is confirmation of a volatility event is occurring with affirmation based upon current momentum (ATR).
The CCI volatility indicator gets confirmation by the the Cumulative Delta Volume indicator which calculates the difference between buying and selling pressure. Volume Delta is calculated by taking the difference of the volume that traded at the offer price and the volume that traded at the bid price. The more volume that is traded at the bid price, the more likely there is momentum in the market.
And lastly the Squeeze Momentum indicator which uses a combination of Bollinger Bands, Keltner Channels and Momentum are used to again confirm momentum and volatility. During periods of low volatility, Bollinger bands narrow and trade inside Keltner channels. They can only contract so much before it can’t contain the energy it’s been building. When the Bollinger bands come back out, it explodes higher. When we see the histogram bar exploding into green above 0 that is a clear confirmation of increased momentum and volatile. The opposite (red) below 0 is true when there are low periods. This indicator is used as a means to really determine when there is premium selling plays going on leading to big directional movements again confirming the positive or negative momentum and volatility direction.
If you know of or have a strategy you want to see myth-busted or just have an idea for one, please feel free to message me.
Trading Rules
1 - 3 min candles
FOREX or Crypto
Stop loss at swing high/low | 1.5 risk/ratio
Long Condition
Trend Magic line is Blue ( CCI is above 0) and above the current close on the bar
Squeeze Momentum's histogram bar is green/lime
Cumulative Delta Volume line is green
Short Condition
Trend Magic line is Red ( CCI is below 0) and below the current close on the bar
Squeeze Momentum's histogram bar is red/maroon
Cumulative Delta Volume line is peach

ka66: Alpha-Configurable EMAAllows directly modifying the Alpha/Smoothing Factor parameter of an EMA. This can allow for very close fits to price movement, instead of the more standard coarse-grained approach of adjusting smoothing via the look-back period.
Furthermore, we allow smoothing this EMA further by passing the original EMA through the EMA function again, and the output of this, yet again, to as many smoothing iterations are desired. For efficiency and practicality, limited to 10 iterations. This is inspired by indicators such as the DEMA.
Finally, we allow producing bands, with a configurable multiplier, around the final EMA. Useful for dynamic S/R levels, e.g. to use as trailing stop zones.

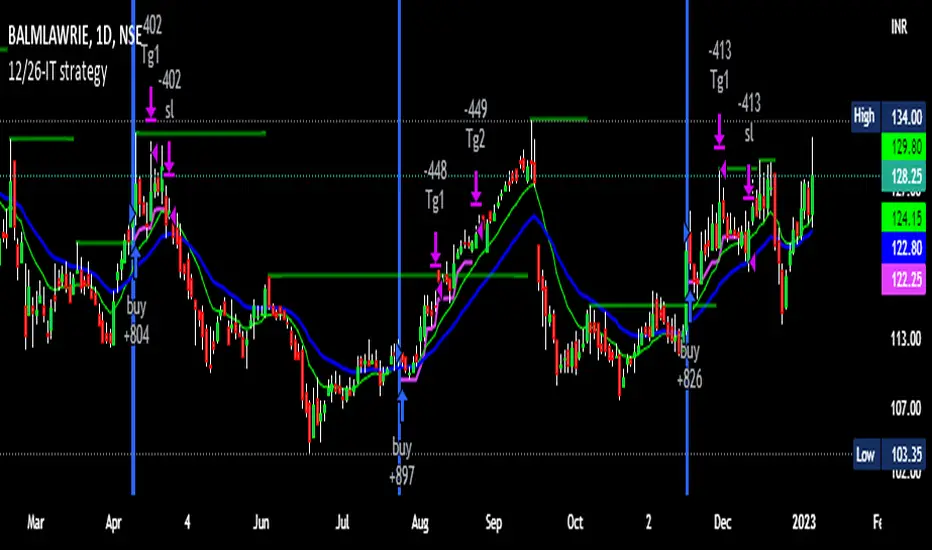
12/26-IT strategyBase of this Strategy is crossover of 12EMA on 26EMA.
Also multiple other criteria has to meet for buy signal, Criterias mentioned below
//////////////////////////////////
There two entry option to select. Either one or both can be selected:
1. Only 12/26 Cross over
a. 12/26 crossover.
b. RSI (14) value to be between a range (RSI is inbuilt, but lower and upper range can be defined in settings)
c. MACD (12, 26) to be positive and above signal line (this is inbuilt)
2. Recent 12/26 Cross over and closing above pivot point(resistance)
a. 12/26 crossover has to be recent, CrossOverLookbackCandles value will look for crossover in # previous candles..
b. RSI (14) value to be between a range (RSI is inbuilt, but lower and upper range can be defined in settings)
c. MACD (12, 26) to be positive and above signal line (this is inbuilt)
d. closing above resistance line
//////////////////////////////////
For Exit we have three options. you can select any SL as per your need, multiple SLs can also be selected
1. Trailing Stop Loss.
Source for TSL is adjustable(open, close, high or low), also you have to mention % below your source TSL has to be placed.
Once closing is below TSL, exit will be triggered.
2. Closing below 7SMA
After 7SMA SL is enabled, 7SMA will be plotted on chart and exit signal will be triggered when closing is below 7SMA.
Choose this option for LESS risk and rewards
3. 12/26 Crossdown
Once 12EMA crossdown below 26EMA, exit will be triggered.
Choose this option for HIGH risk and rewards
//////////////////////////////////
Resistance line is plotted based on left and right candles, if 10(can be changed) is used for both left and right, indicator will look for 10 candles in left and 10 candles in right and if both left and right candle are lower then a line is plotted.
Source has to be selected (close or high)
//////////////////////////////////
Qty mentioned in Buy trigger will be based on BUYVALUE entered
//////////////////////////////////
Multiple Target option is available, if first target is matched how much percentage of qty to be sold can be defined.
If you wish to have only one Target, then exit qty in first target must be 100
Extended Recursive Bands StrategyThe original indicator was created by alexgrover .
All credit goes to alexgrover for creating the indicator that this strategy uses.
This strategy was posted because there were multiple requests for it, and no strategy based on this indicator exists yet.
The Recursive Bands Indicator, an indicator specially created to be extremely efficient, I think you already know that calculation time is extra important in algorithmic trading, and this is the principal motivation for the creation of the proposed indicator. Originally described in Alex's paper "Pierrefeu, Alex (2019): Recursive Bands - A New Indicator For Technical Analysis", the indicator framework has been widely used in his previous uploaded indicators, however it would have been a shame to not upload it, however user experience being a major concern for me, I decided to add extra options, which explain the term "extended".
The Indicator
The indicator displays one upper and one lower band, every common usages applied to bands indicators such as support/resistance , breakout, trailing stop, etc, can also be applied to this one. Length controls how reactive the bands are, higher values will make the bands cross the price less often.
In order to provide more flexibility for the user alexgrover added the option to use various methods for the calculation of the indicator, therefore the indicator can use the average true range , standard deviation, average high-low range, and one totally exclusive method specially designed for this indicator.
Added logic:
We have implemented a logic that checks whether the bands have been following in the same direction for a set amount of bars. This logic must be true before it can enter trades. This is completely new code that was written by us entirely, and it makes a huge difference on strategy performance.
Strategy Long conditions:
1 — Price low is below the the lower band.
2 — The lower band keeps increasing in value until the 'lookback' setting amount of bars is reached.
Strategy Short conditions:
1 — Price high is above the upper band.
2 — The upper band keeps decreasing in value until the 'lookback' setting amount of bars is reached.
Strategy Properties:
We have set a default commission of 0.06% because these are Bybit's fees. The strategy uses an order size of 10% of equity, since drawdown is very low like this. We also use a 10 tick slippage to keep results realistic and account for this. All other settings were left as default apart from initial capital, just to decrease the size of the numbers.

3 EMAs: Daily fixed and custom timeframe (cajole)Simply adds 3 exponential moving averages (EMAs) to the chart. Two are fixed to the daily scale (e.g., 200 and 50 days) and one adjusts to the chart's scale (e.g. 8 bars).
To use the 8-EMA as a trail stop, you can enable labels on the plot or on the price axis.
MACD strategy + Trailstop indicatorWelcome traveler !
Here is my first indicator I made after 3 days of hardlearning pine code (beginner in coding).
I hope it will please you, if you have any suggestion to enhance this indicator, do not hesitate to give me your thoughts in the comments section or by Private message on trading View !
How does it works ?
It's a simple MACD strategy as describe here :
Uses of EMA 200 as a trend confirmer,
For sells :
When above Zero line (MACD) and under EMA200, we go on sell (background color is red)
For buys:
When under Zero line (MACD) and above EMA 200, we go on Buy (back ground color is green)
FILTERS !
I haded one filter to reduce noise on the indicator :
Signals aren't taken if one of the 14 last candles closed on the other side of the EMA 14.
What are the green and red lines ?
The green line is equivalent of a potential stop loss as a buyer side, same for the red one on seller side !
To make the space with the price bigger, please use "ATR multiplier" in the input options of the indicator while on your chart !
Is it timeframe specific ?
Hell no it is not timeframe specific ! You can try to use it on every timeframe !
As usual, I like to remind you that the best way to test an indicator is to go backtest it or to paper trade before using it on real market conditions !
If you find an idea of filter for a specific timeframe, do not hesitate to contact me ! I'll try to do my best to enhance this indicator as the time goes !
Is there repainting ?
There is no repainting on confirmation !
There's only a movement that I don't know how to ignore on the current open candle for the trail stop indicator I built, it should not be a problem if you place alerts to automatise your trading on the close of the candle, and not the high or low !
If you know how to resolve this problem with my code, I would be glad to get your tips to enhance the script ! :)
Example of the indicator in market (backtest, as said, no repaint on confirmation) :

Supertrend B&SSuperTrend is one of the most common ATR based trailing stop indicators.
In this version you can change the ATR calculation method from the settings. Default method is RMA, when the alternative method is SMA .
The indicator is easy to use and gives an accurate reading about an ongoing trend. It is constructed with two parameters, namely period and multiplier. The default values used while constructing a superindicator are 10 for average true range or trading period and three for its multiplier.
The average true range (ATR) plays an important role in 'Supertrend' as the indicator uses ATR to calculate its value. The ATR indicator signals the degree of price volatility .
The buy and sell signals are generated when the indicator starts plotting either on top of the closing price or below the closing price. A buy signal is generated when the ‘Supertrend’ closes above the price and a sell signal is generated when it closes below the closing price.
It also suggests that the trend is shifting from descending mode to ascending mode. Contrary to this, when a ‘Supertrend’ closes above the price, it generates a sell signal as the colour of the indicator changes into red.
A ‘Supertrend’ indicator can be used on equities, futures or forex, or even crypto markets and also on daily, weekly and hourly charts as well, but generally, it fails in a sideways-moving market.

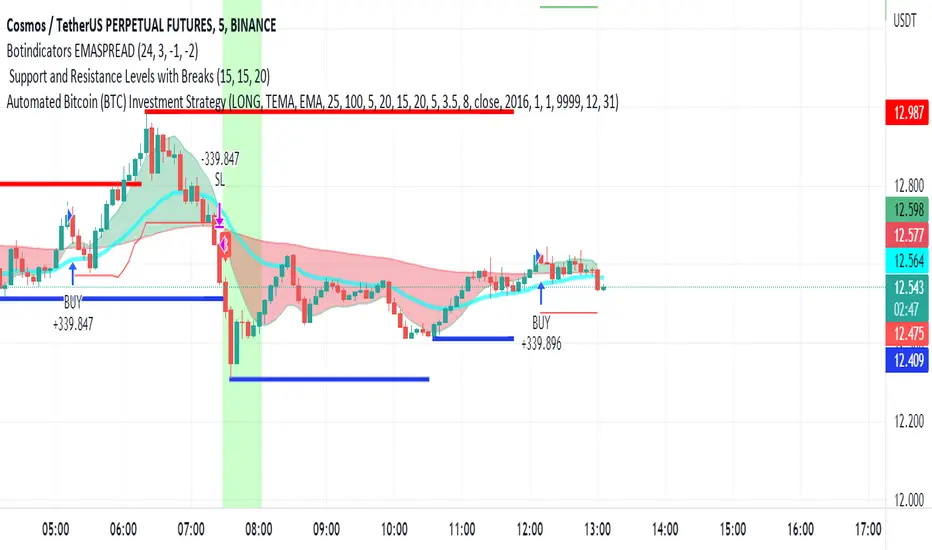
BTC Good SignalThis strategy uses the intersection between the triple exponential moving average and the least square moving average. We also control for the profit that you will gain during the upward trend by implementing the trailing stop based on the ATR indicator. This is the strategy for the spot market only and can be primarily used for long-term investors.
Stock Tech Bot One ViewTechnical indicators are not limited. Hence, here is another indicator with the combination of OBV, RSI, and MACD along with support, and resistance that follows the price while honoring the moving average of 200, 90 & 50.
The default lookback period of this indicator is 21 though it is changeable as per the user's desire.
The highest high and lowest low for the last 21 days lookback period proven to be the perfect Support & Resistance as the price of particular stock values are decided by market psychology. The support and resistance lines are very important to understand the market psychology which is very well proven with price action patterns and the lines are drawn based on,
Lower Extreme = 0.1 (Changeable)
Maximum Range = 21 days highest high - 21 days lowest low.
Support Line = 21 days lowest low + (Maximum Range * Lower Extreme)
Resistance Line = 21 days highest high - (Maximum Range * Lower Extreme)
RSI - Relative strength indicator is very famous to find the market momentum within the range of 0 - 100. Though the lookback period is changeable, the 14 days lookback period is the perfect match as the momentum of market movement for the last 3 weeks will always assist to identify the market regime. Here the momentum is just to highlight the indication (green up arrow under the candle for long and red down arrow above the candle for short) of market movement though it is not very important to consider if the price of the stock respect the support & resistance lines along with volume indicator (* = violet color).
OBV - Momentum:
The on-balance volume is always going indicator on any kind of tickers, which helps to identify the buying interest. Now, applying momentum on OBV with the positive movement for at least two consecutive days gives perfect confirmation for entry. A combination of the price along with this momentum(OBV) in the chart will help us to know the whipsaw in the price.
The Symbol "*" on top of each bar shows the market interest in that particular stock. If your ticker is fundamentally strong then you can see this "*" even when the market falls.
MACD:
One of the favorites and simple indicators widely used, where the thump of the rule is not to change the length even if it is allowed. It's OK to believe blindly in certain indicator and consider it while trading. That's why the indicator changes the bar color by following the MACD histogram.
Volume:
It may be the OBV works based on the open price and close price along with volume movement, it is wise to have the volume that is plotted along with price movement that should help you to decide whether the market is greedy or fearful.
The symbol "-" on top of each bar tells you a lot and don't ignore it.
Moving Average:
Moving average is a very good trend indicator as everyone considers seeing along with the price in the chart which is not omitted while we gauge the price movement alone with volume in this indicator. The 200, 90 & 50 MA's are everyone's favorite, and the same is plotted on the chart.
As explained above, the combination of all four indicators with price movement will give us very good confidence to take entry.
Candlestick Pattern:
You should admire the techniques of the candlestick pattern as you navigate the chart from right to left. Though there are a lot of patterns that exist, it is easy to enable and disable to view the signal as the label.
Further, last but not least, the exit always depends on individual conviction and how often the individual watch the price movement, if your conviction is strong then follow the down arrow red indication. If not, then exit with a trailing stop that indicates the bar with orange color.
Happy investing
Note: It is just a combination of multiple indicators and patterns to get one holistic view. So, the credit goes to all wise developers who publically published.

Chandelier Exit - Heikin AshiThis is a redesign of the Chandelier Exit indicator. It removes stupid transitions between Chandelier Exit' states and highlights initial points for both lines.
This indicator was originally developed by Charles Le Beau and popularized by Dr . Alexander Elder in his book "Come Into My Trading Room: A Complete Guide to Trading" (2002).
In short, this is a trailing stop-loss based on the Average True Range (ATR).
If "Heikin Ashi for calculation" is checked, then ATR and buy/sell signals are calculated based on heikin ashi candles.
You don't need to change bar style to heikin ashi.
Thanks to everget for the initial version.
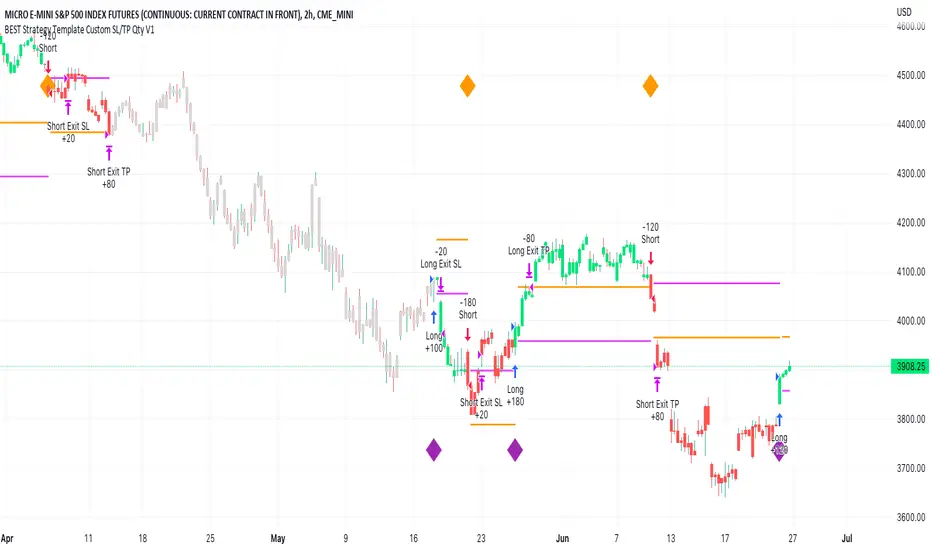
BEST Strategy Template w/ Custom SL/TP Size - EducationalHello traders
I'm getting this question at least once per week: "how to define a custom exit quantity for my stop loss and a different one for my take profit"
Instead of answering every day the same question in my DMs, I've decided to publish an educational strategy template script using this
Features
- Select to use or not the SL and/or TP
- Define how many pips/USD the SL/TP should be set at from the entry
- Define what quantity percentage you want to close at SL and/or at TP (lines 301 to 320 in the code)
- Classical custom trailing stop where the SL is moved to breakeven once the TP is hit
- Get real-time backtesting stats based on the options you've selected
Update
You might not know it yet but from last week (or maybe the week before), the qty/qty_percent from the strategy.exit function refers now to the initial position size (and not the remaining position size like before)
For example:
strategy.exit("EX1", qty_percent = 50, stop = constant)
strategy.exit("EX2", qty_percent = 20, stop = constant)
What happened before
After "EX1" reaches SL levels, "EX2" exits 20% from the % of the remaining position size.
If the initial position size = 100 contracts
EX1 exits 50 contracts
EX2 exits 20% of 50 contracts = 10 contracts
What's happening now
After "EX1" reaches SL levels, "EX2" exits 20% from the % of the original position size.
If the initial position size = 100 contracts
EX1 exits 50 contracts
EX2 exits 20 (20% of 100 contracts) contracts
I think this is an improvement and I really enjoy this new behavior.
See you in a few days with another post :)
ALL THE BEST
Dave